Figure Gallery
Browse selected RISK figures across yeast, physics, and HuRI analyses.
Gallery
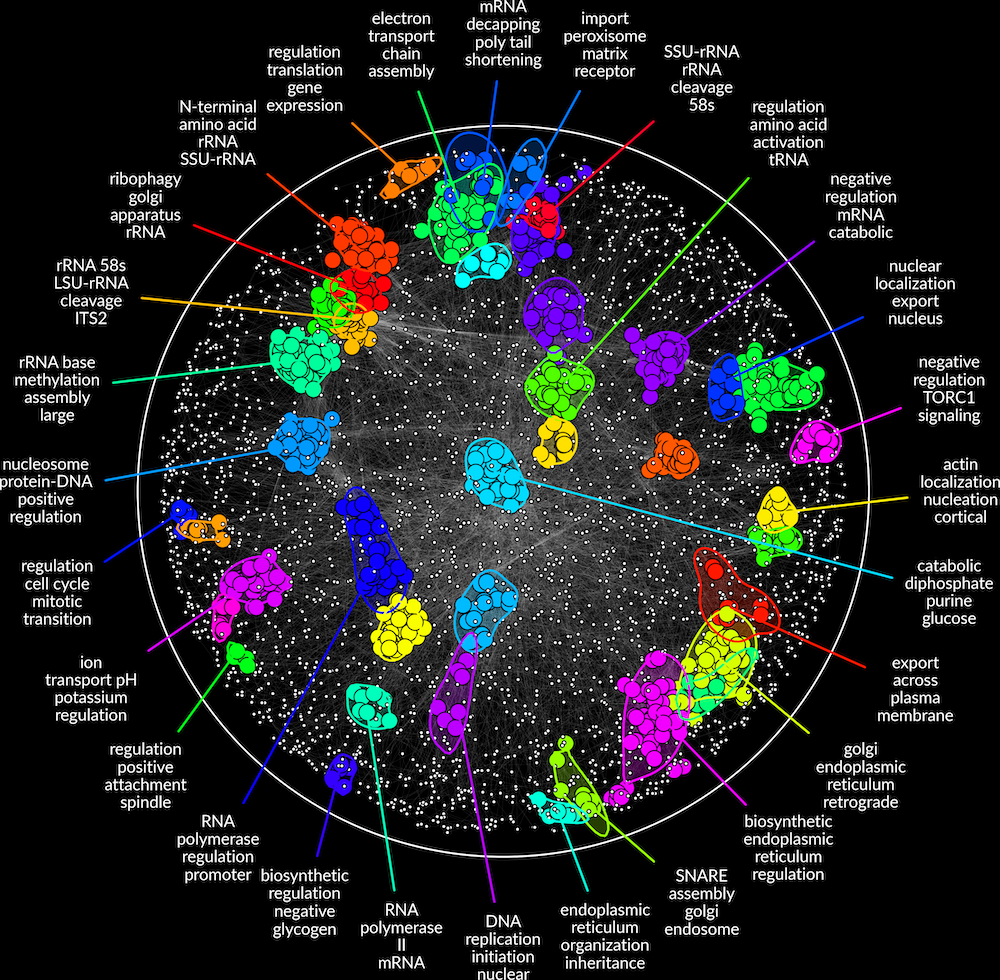
Figure 1B. Yeast protein–protein interaction (PPI) network.
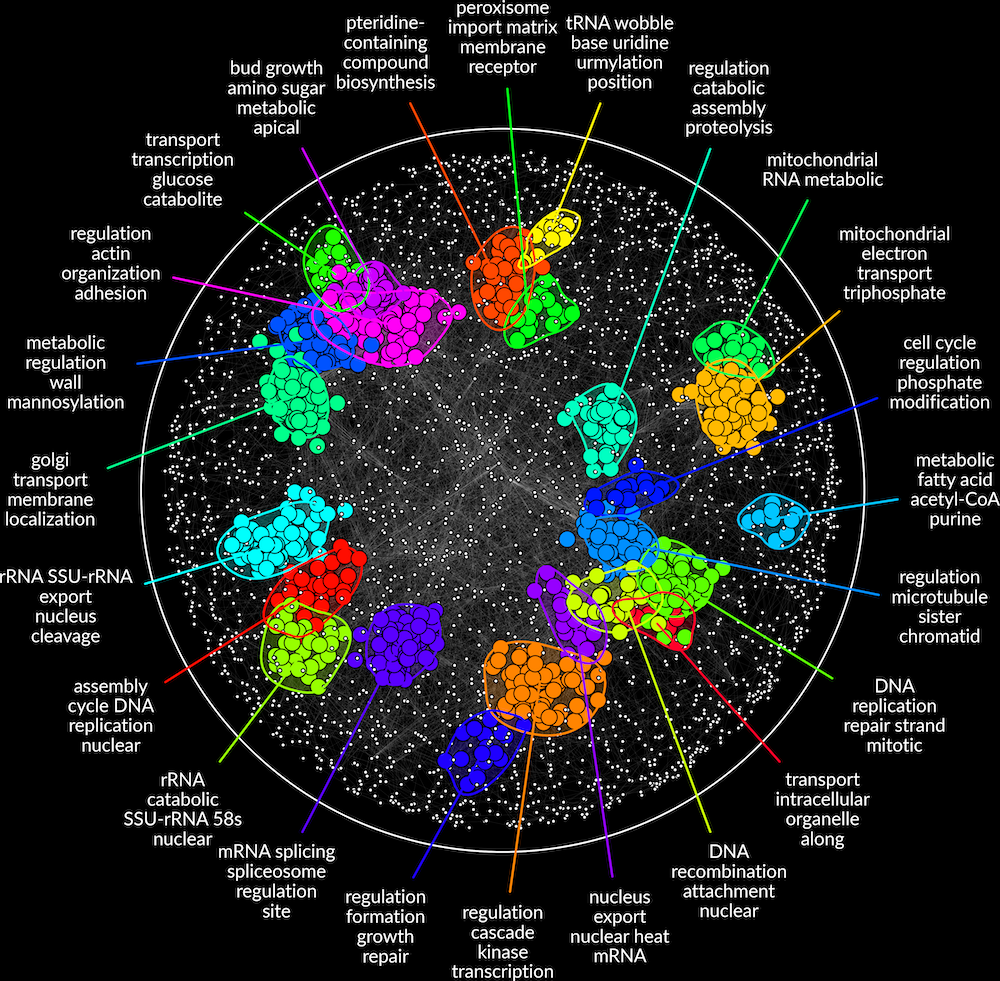
Supplementary Figure S1. Yeast genetic interaction network.
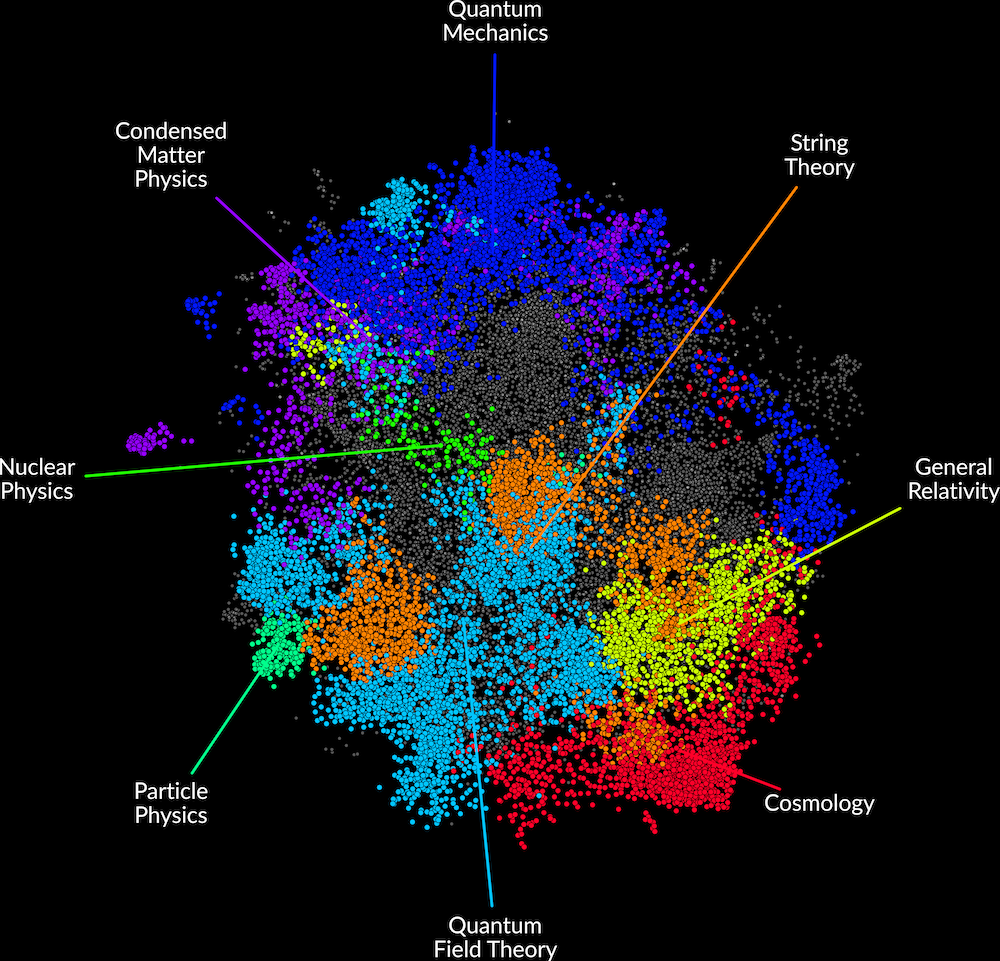
Supplementary Figure S7. High-energy physics citation network.
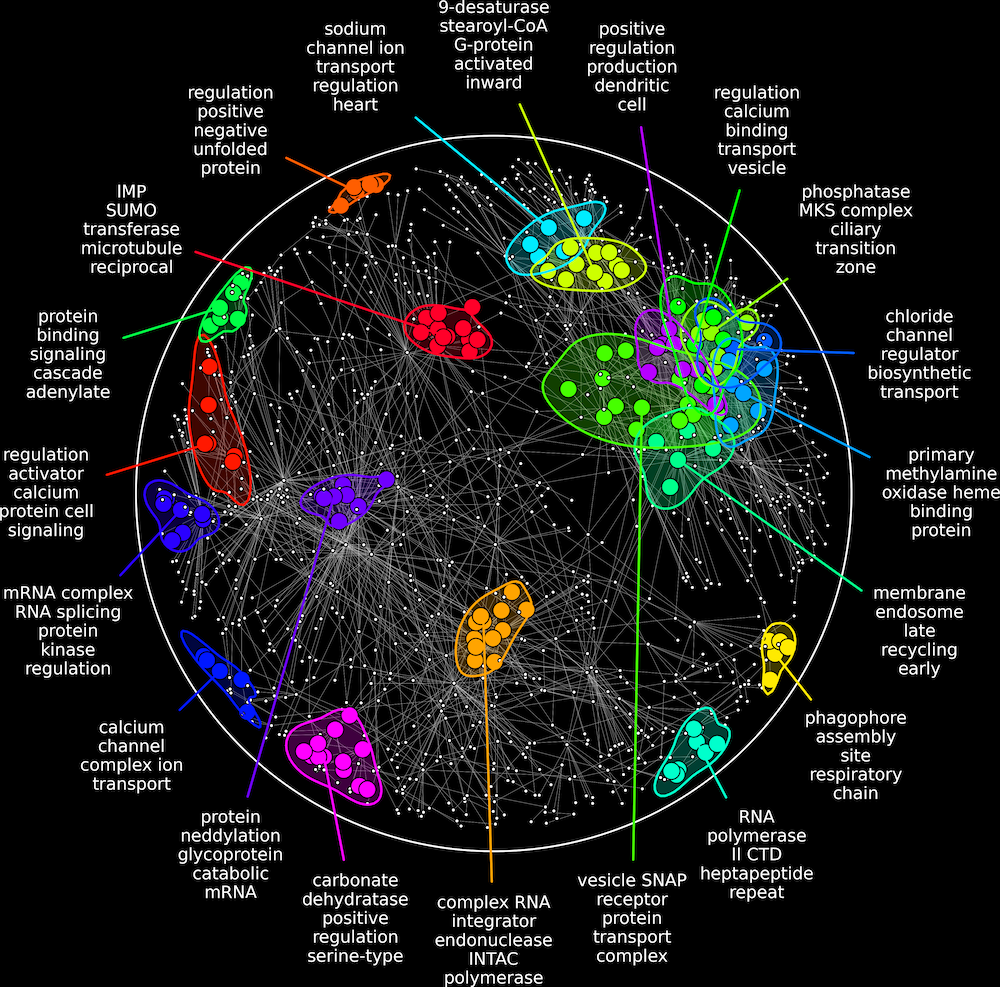
HuRI: Human brain cerebellum network.
Citations
Figures 1B, S1, and S7
Horecka, I., and Röst, H. (2026)
RISK: a next-generation tool for biological network annotation and visualization
Bioinformatics. https://doi.org/10.1093/bioinformatics/btaf669
Human HuRI brain cerebellum
Luck, K., Kim, DK., Lambourne, L. et al. (2020)
A reference map of the human binary protein interactome
Nature 580, 402-408. https://doi.org/10.1038/s41586-020-2188-x
Note: Panel generated with RISK from a HuRI-derived brain cerebellum PPI network dataset; not reproduced from a figure in Luck et al. (2020).